Glances gives a quick overview of system usage on Linux

Monitor your Linux system
 As a Linux sysadmin it feels great power when monitoring system resources like cpu, memory on the commandline. To peek inside the system is a good habit here atleast, because that’s one way of driving your Linux system safe. Plenty of tools like Htop, Nmon, Collectl, top and iotop etc help you accomplish the task. Today lets try another tool called Glances.
Glances
Glances is a tool similar to Nmon that has a very compact display to provide a complete overview of different system resources on just a single screen area. It does not support any complex functionality but just gives a brief overview CPU, Load, Memory, Network rate, Disk IO, file system, process number and details.
As a bonus, glances is actually cross platform, which means you can use it on obsolete OSes like windows :P.
Here’s a quick glimpse of it.
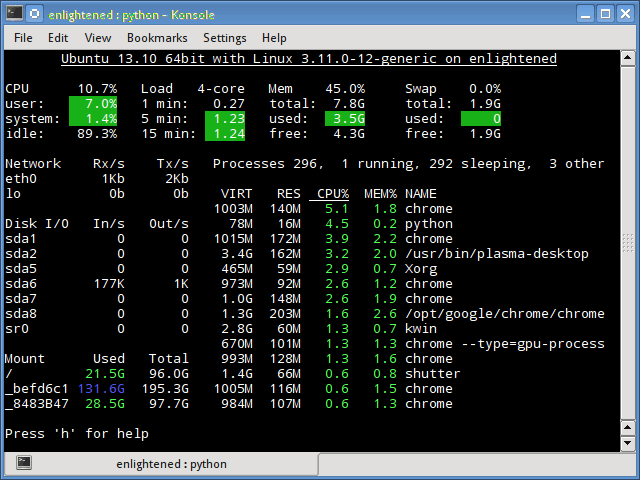 

The output is color highlighted. Green indicates optimum levels of usage whereas red indicates that the particular resource is under heavy use.
$ glances -v
Glances version 1.6 with PsUtil 0.6.1
Project homepage https://github.com/nicolargo/glances http://nicolargo.github.io/glances/
The man page description
Glances is a free (LGPL) curses-based monitoring tool which aims to present a maximum of information in a minimum of space, ideally to fit in a classical 80×24 terminal or higher to have additionnal information. Glances can adapt dynamicaly the displayed information depending on the terminal size. It can also work in a client/server mode (for remote monitoring). This tool is written in Python and uses PsUtil to fetch the statis‐tical values from key elements.
Next task is to install Glances. Most popular distributions have Glances in their default repositories. Here is a detailed description from the project website.
- At the moment, packages exist for the following distributions
- Arch Linux
- Debian (Testing/Sid)
- Fedora/CentOS/RHEL
- Gentoo
- Ubuntu (13.04 )
- Void Linux
- So you should be able to install it using your favorite package manager.
Install glances on Ubuntu or Debian
Ubuntu and Debian users can install from default repositories.
$ sudo apt-get install glances
Install glances on Fedora or CentOS
Fedora users can install from default repositories using yum.
$ sudo yum install glances
CentOS users need to first setup the epel repository and then install using yum as shown above.
Or install it from Python Package Index repository.
# fedora/centos
$ sudo yum install python-pip
$ sudo pip install glances
Using glances
Once installed, start using it right away. Just type in the name and hit enter.
$ glances
The user interface is interactive and you can gear it with keyboard shortcuts. Here is a list
'a' Automatic mode. The process list is sorted automatically
'b' Switch between bit/s or Byte/s for network IO
'c' Sort processes by CPU%
'd' Show/hide disk IO stats
'f' Show/hide file system stats
'h' Show/hide the help message
'i' Sort processes by IO rate
'l' Show/hide log messages
'm' Sort processes by MEM%
'n' Show/hide network stats
'p' Sort processes by name
's' Show/hide sensors stats (Linux-only)
'w' Delete finished warning logs messages
'x' Delete finished warning and critical logs
'q' Quit
'1' Switch between global CPU and per core stats
So if you want to see the stats per cpu instead of overall, then press ‘1’ when glances is running.
Display sensor information
To display sensor information glances needs pysensors library to be installed. Follow these instructions to install the dependencies.
# ubuntu/debian
$ sudo apt-get install python-pip
$ sudo pip install pysensors
# fedora/centos
$ sudo yum install python-pip lm_sensors
$ sudo pip install pysensors
Now run glances with the e option
$ glances -e
Set the refresh interval
Glances by default refreshes stats every 3 seconds. To get a more real time output set the interval rate using the t option.
$ glances -t 1
Remote monitoring with server mode
Glances supports remote monitoring through client/server sockets, and needs no extra setup at all.
On the server side, that is the machine you wish to monitor, launch glances in server mode with the following command
$ glances -s
Glances server is running on 0.0.0.0:61209
Now from the local machine (that is the client side), tell glances to connect to the remote machine and display the stats.
$ glances -c 192.168.1.3
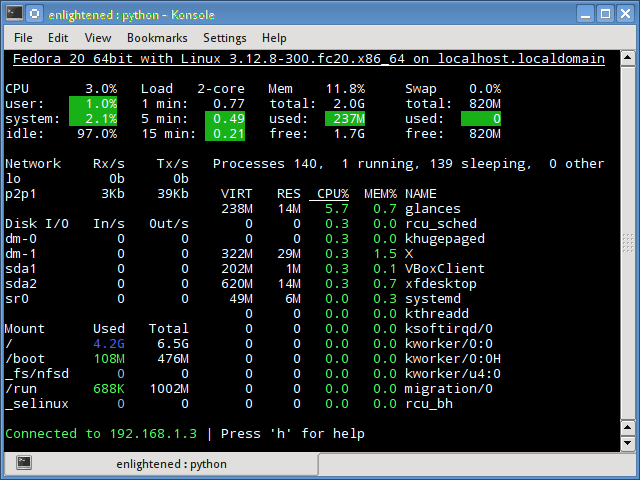
A line at the bottom would indicate the remote machine’s ip address/hostname.
Additionally you can specify a address and port to bind the glances server using the B and p options respectively.
$ glances -s -B 127.0.0.1 -p 8889
Glances server is running on 127.0.0.1:8889
Ensure that the server is allowing incoming tcp connections on the port number that glances starts its server on.
On distros like Fedora and CentOS iptables has a default configuration to block incoming connections on all ports except few ones like ssh.
Here is a sample iptables command to open the port number of your choice
# create new rule
$ sudo iptables -I INPUT 5 -i eth0 -p tcp --dport 61209 -m state --state NEW,ESTABLISHED -j ACCEPT
# save new rule to make it permanent
$ service iptables save
iptables: Saving firewall rules to /etc/sysconfig/iptables:[ OK ]
Configuring thresholds
Glances shows 4 different types of colors for various statistics.
GREEN: OK (everything is fine)
BLUE: CAREFUL (need attention)
VIOLET: WARNING (alert)
RED: CRITICAL (critical)
The colors are indicated based on certain threshold levels which is configured in the file located at
/etc/glances/glances.conf
The configuration file contains threshold values for every statistic that glances reports. For example
[filesystem]
 # Defaults limits for free filesytem space in %
 # Defaults values if not defined: 50/70/90
 careful=50
 warning=70
 critical=90
Anything lower than those 3 levels is marked ‘OK’ that is green. Sysadmins can change the values depending on how soon they want the alerts.
Source: BinaryTides