How to monitor OpenFlow messages with packet sniffer

As a key enabler for software-defined networking (SDN), OpenFlow was initially introduced in the academia as a way to enable innovation on production networks which had traditionally been built with closed and proprietary networking hardware. OpenFlow offloads the high-level routing/forwarding decisions (control plane) from networking devices such as switches, and moves the control plane on to a separate controller. The networking devices then simply forward traffic, as programmed by the external OpenFlow controller. It is the OpenFlow protocol that is used by the OpenFlow controller to program the networking devices.
Suppose you have an OpenFlow testbed running, which consists of an OpenFlow controller and a set of OpenFlow-capable switches. For troubleshooting purposes, you want to capture and examine OpenFlow messages exchanged between the controller and the switches. For this you could monitor exchanged OpenFlow messages either at the controller or the switch side, but what if it is not convenient to do so? Another way is to « sniff » network packets on the OpenFlow control channel and interpret the packets.
In this tutorial, I am going to show how to sniff live OpenFlow control packets and decode OpenFlow messages contained in the packets.
Note that for such packet sniffing to work, SSL must be disabled in any existing OpenFlow control channels between the controller and switches. Let’s assume we are not talking about any production environment here, so the SSL is off for now.
Method One: Sniff OpenFlow Messages via Wireshark GUI
If you want to monitor OpenFlow messages using packet sniffing, the most user-friendly way is via Wireshark, a GUI-based packet sniffer. A nice thing about Wireshark is its extensive list of built-in and custom dissectors. Each dissector decodes some part of packet data based on a specific network protocol. For pretty much any existing network protocol, there is a corresponding Wireshark dissector (either built-in or contributed by a third-party). The OpenFlow protocol is not an exception.
While there is an official OpenFlow dissector, I am going to use a third-party OpenFlow dissector developed by Big Switch Networks, since the former seems to have patchy/incomplete support for different OpenFlow versions.
Here is how to install the OpenFlow dissector for Wireshark.
$ mkdir -p ~/.wireshark/plugins
$ cd ~/.wireshark/plugins
$ wget http://www.projectfloodlight.org/openflow.lua
Now go ahead and start Wireshark.
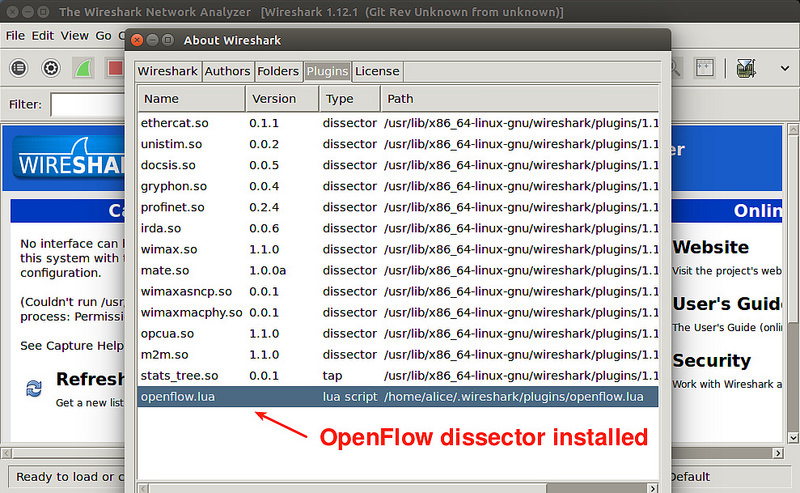
To verify that the OpenFlow dissector is successfully installed, go to « Help » -> »About Wireshark ».
Under the « Plugin » tab, if you see openflow.lua listed, it means the Openflow dissector is successfully loaded on Wireshark.
Now go ahead and start capturing traffic on the network interface which is supposed to see OpenFlow control traffic.
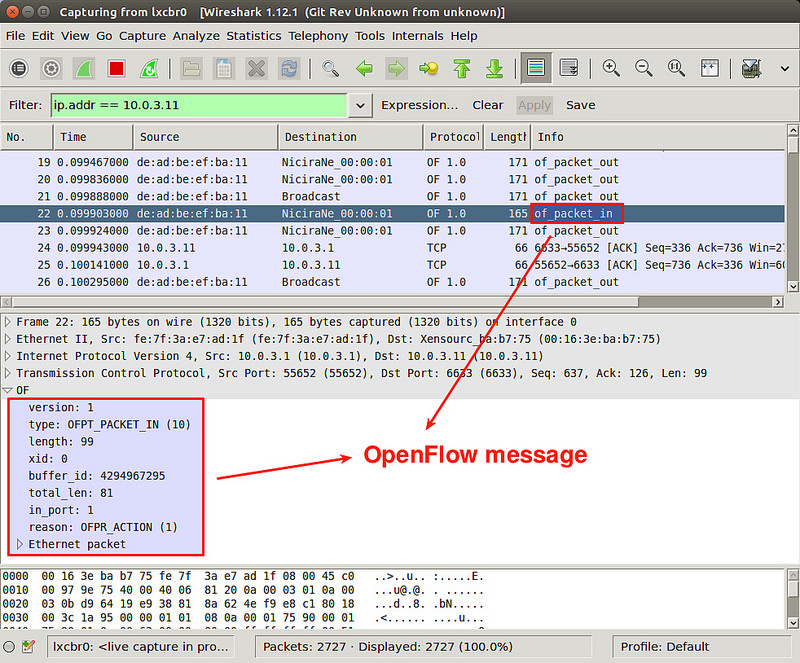
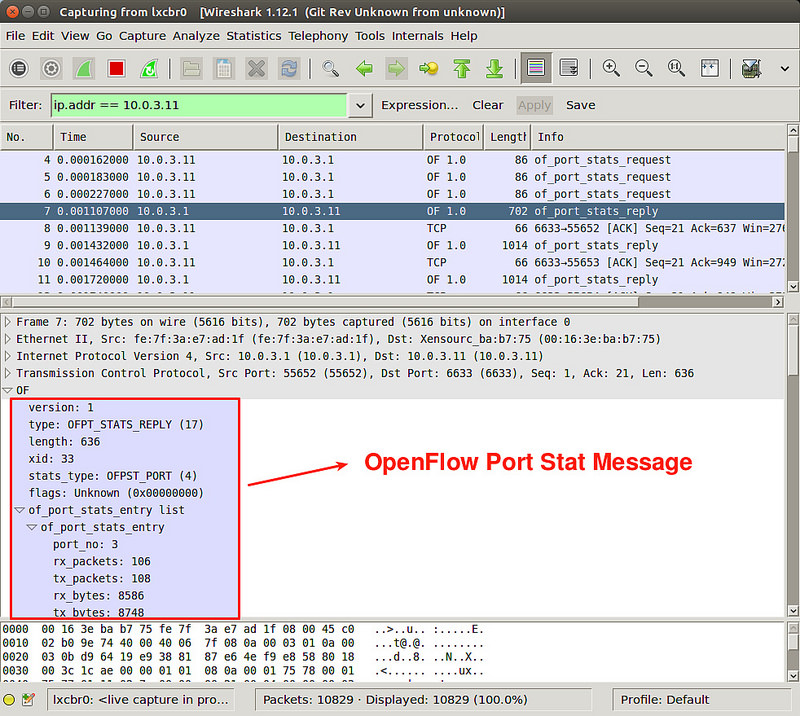
If Wireshark captures any OpenFlow protocol packet, it will automatically show « of_XXXX » in the « Info » field. To see the content of the OpenFlow message, check the packet details pane. Each OpenFlow message is typically very small, fitting into a single packet.
For example, the following screenshot shows the « Packet-In« -type OpenFlow message.
And « Port Status« -type OpenFlow message:
Method Two: Sniff OpenFlow Messages from the Command Line
If you are on a headless server without GUI, you can still sniff OpenFlow control traffic from the command line. For this you can use tshark, a command-line packet sniffer which comes with the Wireshark package.
First, check what OpenFlow versions are supported for sniffing:
$ tshark -G protocols | grep -i openflow
OpenFlow	openflow	openflow
OpenFlow 1.0	openflow_v1	openflow_v1
OpenFlow 1.3	openflow_v4	openflow_v4
OpenFlow 1.4	openflow_v5	openflow_v5
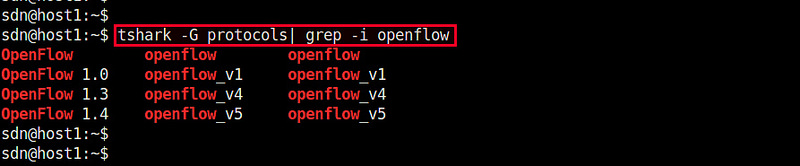
According to the output, it supports OpenFlow version 1.0, 1.3 and 1.4. The 2nd/3rd column indicates the protocol identifier to be specified in the tshark command line.
To sniff OpenFlow protocol traffic, use the following command line.
$ sudo tshark -i <interface> -d tcp.port==<port-number>,openflow -O <protocol-identifier>
For example, if you want to sniff OpenFlow v1.3 traffic at port 6633, run the following command.
$ sudo tshark -i eth0 -d tcp.port==6633,openflow -O openflow_v4
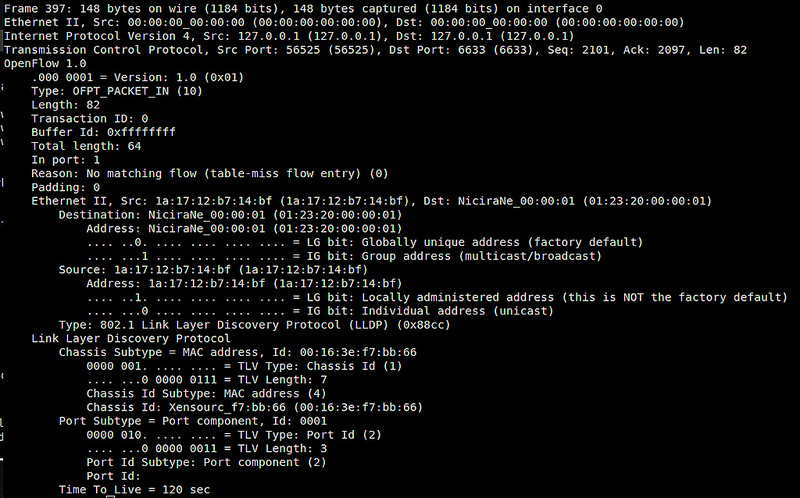
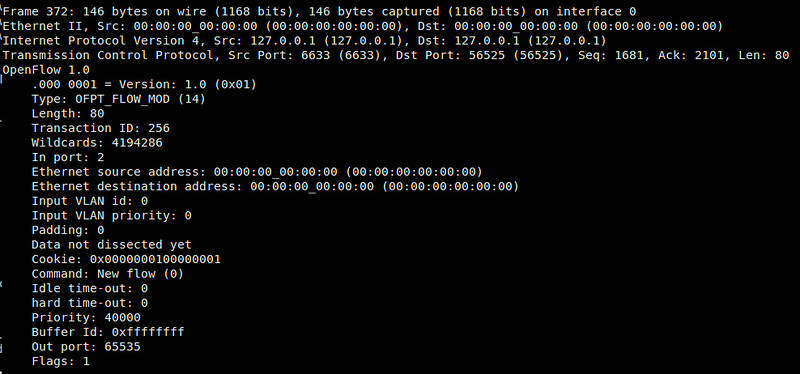
Here are some example screenshots of tshark capturing OpenFlow version 1.0 messages.
OpenFlow Features Reply message:

OpenFlow Packet-In message:
OpenFlow Flow-Mod message:
Hope this guide helps.
Source: Xmodulo