How to analyze and view Apache web server logs interactively on Linux

 Whether you are in the web hosting business, or run a few web sites on a VPS yourself, chances are you want to display visitor statistics such as top visitors, requested files (dynamic or static), used bandwidth, client browsers, and referring sites, and so forth.
GoAccess is a command-line log analyzer and interactive viewer for Apache or Nginx web server. With this tool, you will not only be able to browse the data mentioned earlier, but also parse the web server logs to dig for further data as well – and all of this within a terminal window in real time. Since as of today most web servers use either a Debian derivative or a Red Hat based distribution as the underlying operating system, I will show you how to install and use GoAccess in Debian and CentOS.
Installing GoAccess on Linux
In Debian, Ubuntu and derivatives, run the following command to install GoAccess:
# aptitude install goaccess
In CentOS, you’ll need to enable the EPEL repository and then:
# yum install goaccess
In Fedora, simply use yum command:
# yum install goaccess
If you want to install GoAccess from the source to enable further options (such as GeoIP location), install required dependencies for your operating system, and then follow these steps:
# wget http://tar.goaccess.io/goaccess-0.8.5.tar.gz
# tar -xzvf goaccess-0.8.5.tar.gz
# cd goaccess-0.8.5/
# ./configure --enable-geoip
# make
# make install
That will install version 0.8.5, but you can always verify what is the latest version in the Downloads page of the project’s web site.
Since GoAccess does not require any further configurations, once it’s installed you are ready to go.
Running GoAccess
To start using GoAccess, just run it against your Apache access log.
For Debian and derivatives:
# goaccess -f /var/log/apache2/access.log
For Red Hat based distros:
# goaccess -f /var/log/httpd/access_log
When you first launch GoAccess, you will be presented with the following screen to choose the date and log format. As explained, you can toggle between options using the spacebar and proceed with F10. As for the date and log formats, you may want to refer to the Apache documentation if you need to refresh your memory.
In this case, Choose Common Log Format (CLF):
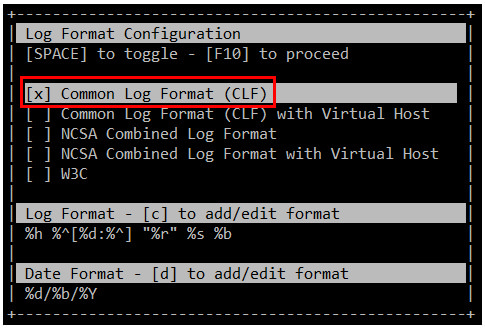
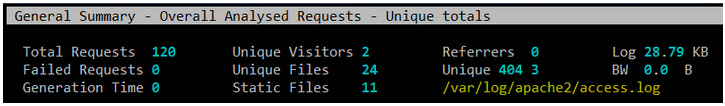
and then press F10. You will be presented with the statistics screen. For the sake of brevity, only the header, which shows the summary of the log file, is shown in the next image:
Browsing Web Server Statistics with GoAccess
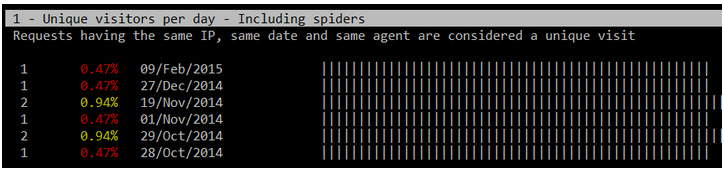
As you scroll down the page with the down arrow, you will find the following sections, sorted by requests. The order of the categories presented here may vary depending on your distribution or your preferred installation method (from repositories or from source):
1. Unique visitors per day (HTTP requests having the same IP, same date and same agent are considered an unique visit)
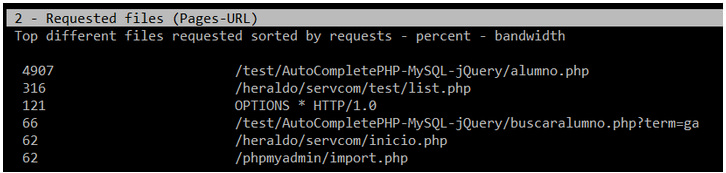
2. Requested files (Pages-URL)
3. Requested static files (e.g., .png, .js, etc)
4. Referrers URLs (the URLs where each request came from)
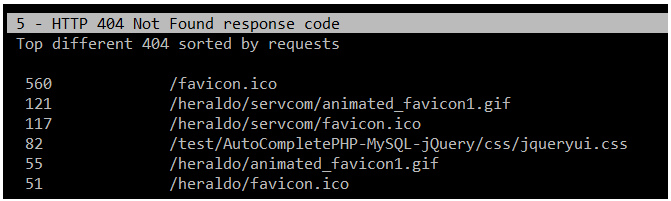
5. HTTP 404 Not Found response code
6. Operating Systems
7. Browsers
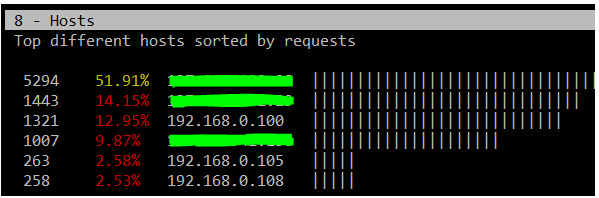
8. Hosts (client IPs)
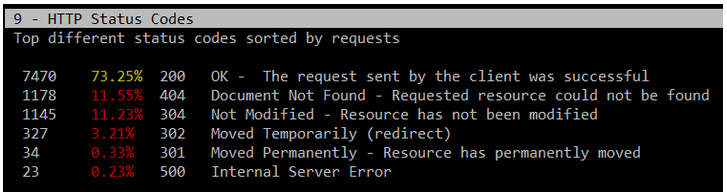
9. HTTP status codes
10. Top referring sites
11. Top keyphrases used on Google’s search engine
If you also want to inspect the archived logs, you can pipe them to GoAccess as follows.
For Debian and derivatives:
# zcat -f /var/log/apache2/access.log* | goaccess
For Red Hat based distributions:
# cat /var/log/httpd/access* | goaccess
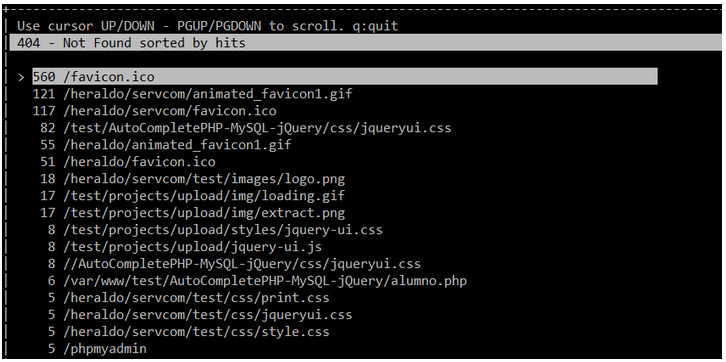
Should you need a more detailed report of any of the above (1 through 11), press the desired section number and then O (uppercase o) to bring up what is called the Detailed View. The following image shows the output of 5-O (press 5, then press O):
To display GeoIP location information, open the Detail View in the Hosts section, as explained earlier, and you will see the location of the client IPs that performed requests to your web server:
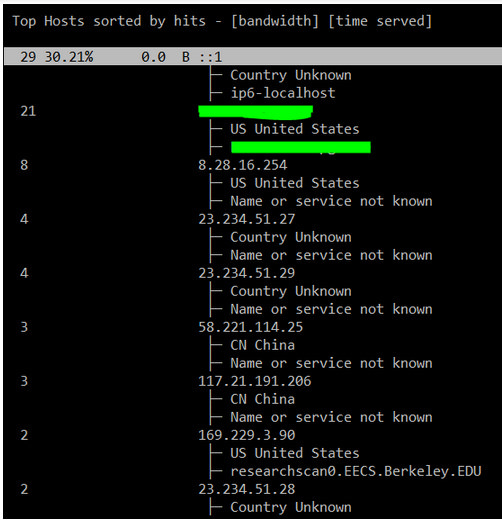
If your system has not been very busy lately, some of the above sections will not show a great deal of information, but that situation can change as more and more requests are made to your web server.
Saving Reports for Offline Analysis
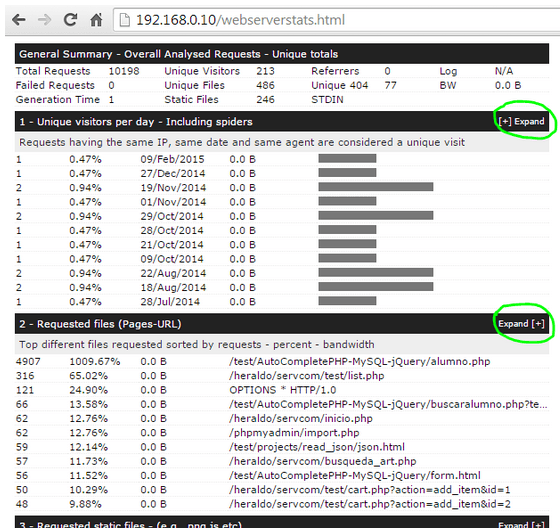
There will be times when you don’t want to inspect your system’s stats in real time, but save it to a file for offline analysis or printing. To generate an HTML report, simply redirect the output of the GoAccess commands mentioned earlier to an HTML file. Then just point your web browser to the file to open it.
# zcat -f /var/log/apache2/access.log* | goaccess > /var/www/webserverstats.html
Once the report is displayed, you will need to click on the Expand link to show the detail view on each category:
As we have discussed throughout this article, GoAccess is an invaluable tool that will provide you, as a system administrator, with HTTP statistics in a visual report on the fly. Although GoAccess by default presents its results to the standard output, you can also save them to JSON, HTML, or CSV files. This converts GoAccess in an incredibly useful tool to monitor and display statistics of a web server.
Source: Xmodulo