Ce document rappelle les commandes et les options les plus utilisées par l’administrateur d’un système Linux. Il s’agit surtout de commandes assez générales, dont tout administrateur aura besoin un jour ou l’autre. Les commandes pour l’utilisateur courant se trouvent dans un autre aide-mémoire. Pour plus d’informations, on consultera les pages de manuel ou les publications du Linux Documentation Project
Une version prête à l’impression recto-verso est disponible pour conserver cet aide-mémoire dans un format facile à ranger dans un tiroir ou sous un clavier.
Informations système
uname – Identification du système.
-a : toutes les informations.
dmesg – Messages du noyau (et ceux du boot).
uptime – Durée et charge du système.
free – Occupation de la mémoire.
vmstat – Détails sur l’utilisation de la mémoire.
ipcs – Utilisation des ressources IPC System V.
ipcrm – Suppression de ressources IPC System V.
ldconfig – Valider les bibliothèques dynamiques.
init – Changement de niveau de fonctionnement :
0 : arrêt.
1 : mono-utilisateur,
3 : multi-utilisateurs mode texte,
5 : multi-utilisateurs mode graphique,
6 : redémarrer.
Utilisateurs
useradd – Ajout d’un utilisateur :
useradd -m -p "" linus
crée un compte linus, avec répertoire personnel et mot de passe vide.
Need to monitor Linux server performance? Try these built-in command and a few add-on tools. Most Linux distributions are equipped with tons of monitoring. These tools provide metrics which can be used to get information about system activities. You can use these tools to find the possible causes of a performance problem. The commands discussed below are some of the most basic commands when it comes to system analysis and debugging server issues such as:
Finding out bottlenecks.
Disk (storage) bottlenecks.
CPU and memory bottlenecks.
Network bottlenecks.
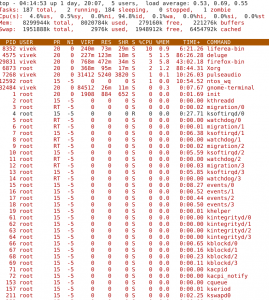
#1: top – Process Activity Command
The top program provides a dynamic real-time view of a running system i.e. actual process activity. By default, it displays the most CPU-intensive tasks running on the server and updates the list every five seconds.
Commonly Used Hot Keys
The top command provides several useful hot keys:
Hot Key
Usage
t
Displays summary information off and on.
m
Displays memory information off and on.
A
Sorts the display by top consumers of various system resources. Useful for quick identification of performance-hungry tasks on a system.
f
Enters an interactive configuration screen for top. Helpful for setting up top for a specific task.
o
Enables you to interactively select the ordering within top.
monit is a utility for managing and monitoring, processes, files, directories and devices on a UNIX system. Monit conducts automatic maintenance and repair and can execute meaningful causal actions in error situations.
Monit Features
Daemon mode – poll programs at a specified interval
Monitoring modes – active, passive or manual
Start, stop and restart of programs
Group and manage groups of programs
Process dependency definition
Logging to syslog or own logfile
Configuration – comprehensive controlfile
Runtime and TCP/IP port checking (tcp and udp)
SSL support for port checking
Unix domain socket checking
Process status and process timeout
Process cpu usage
Process memory usage
Process zombie check
Check the systems load average
Check a file or directory timestamp
Alert, stop or restart a process based on its characteristics
MD5 checksum for programs started and stopped by monit
Alert notification for program timeout, restart, checksum, stop resource and timestamp error
Munin est un outil de surveillance basé sur le célèbre RRDTool, permettant de connaître toutes les données systèmes des autres ordinateurs du réseau. Il les présente automatiquement sous forme de graphiques consultables depuis une page web. Par ailleurs, il dispose d’un système de plugins qui le rend simple d’utilisation et très modulaire.
J’ai choisi de le présenter, et non certains de ses concurrents comme Nagios, Cacti ou Zabbix, car il m’a semblé être le plus simple d’utilisation tout en conservant de fortes possibilités d’adaptation.
Un système Munin est composé de :
un serveur principal, récupérant les informations
un nœud par équipement à surveiller
Il faut signaler qu’avec une telle architecture Munin se différencie de Nagios. Ce dernier préfère en effet centraliser toutes les mesures sur le serveur, ce qui permet de ne rien installer sur les équipements surveillés.
Nous avons installé fail2ban sur chacun de nos serveurs en utilisant ce tutoriel
Le script de monitoring que nous allons utiliser se trouve ici : http://blog.sinnwidrig.org/?p=50. C’est un script générique permettant de créer un graphique distinct par action de fail2ban.
On décide de placer les plugins supplémentaires pour munin dans le répertoire  /opt/share/munin/plugins
#Créer le répertoire des plugins dans le cas ou il n'existe pas déjà
sudo mkdir -p /opt/share/munin/plugins
cd /opt/share/munin/plugins
# Récupérer le script
sudo wget http://blog.sinnwidrig.org/files/fail2ban_-0.1
# Rendre exécutable le script
sudo chmod +x fail2ban_-0.1