Source: munin-monitoring.org There are a number of situations where you’d like to run munin-node on hosts not directly available to the Munin server. This article describes a few scenarios and different alternatives to set up monitoring. Monitoring hosts behind a non-routing server.
In this scenario, a *nix server sits between the Munin server and one or more Munin nodes. The server in-between reaches both the Munin server and the Munin node, but the Munin server does not reach the Munin node or vice versa.
To enable for Munin monitoring, there are several approaches, but mainly either using SSH tunneling or “bouncing” via the in-between server.
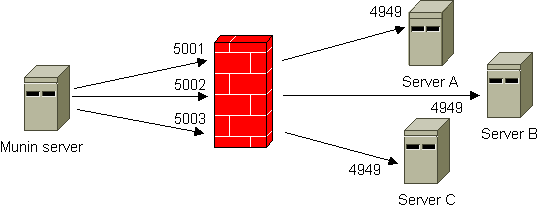
SSH tunneling
The illustration below shows the principle. By using SSH tunneling only one SSH connection is required, even if you need to reach several hosts on “the other side”. The Munin server listens to different ports on the localhost interface. A configuration example is included. Note that there is also a FAQ entry on using SSH that contains very useful information.
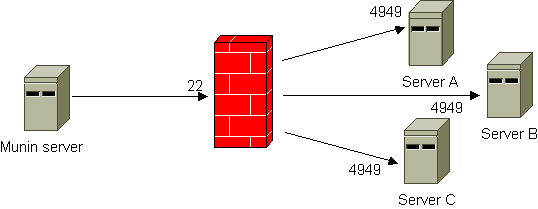
Bouncing
This workaround uses netcat and inetd/xinetd to forward the queries from the Munin server. All incoming connections to defined ports are automatically forwarded to the Munin node using netcat.
Munin est un outil de surveillance basé sur le célèbre RRDTool, permettant de connaître toutes les données systèmes des autres ordinateurs du réseau. Il les présente automatiquement sous forme de graphiques consultables depuis une page web. Par ailleurs, il dispose d’un système de plugins qui le rend simple d’utilisation et très modulaire.
J’ai choisi de le présenter, et non certains de ses concurrents comme Nagios, Cacti ou Zabbix, car il m’a semblé être le plus simple d’utilisation tout en conservant de fortes possibilités d’adaptation.
Un système Munin est composé de :
un serveur principal, récupérant les informations
un nœud par équipement à surveiller
Il faut signaler qu’avec une telle architecture Munin se différencie de Nagios. Ce dernier préfère en effet centraliser toutes les mesures sur le serveur, ce qui permet de ne rien installer sur les équipements surveillés.
Nous avons installé fail2ban sur chacun de nos serveurs en utilisant ce tutoriel
Le script de monitoring que nous allons utiliser se trouve ici : http://blog.sinnwidrig.org/?p=50. C’est un script générique permettant de créer un graphique distinct par action de fail2ban.
On décide de placer les plugins supplémentaires pour munin dans le répertoire  /opt/share/munin/plugins
#Créer le répertoire des plugins dans le cas ou il n'existe pas déjà
sudo mkdir -p /opt/share/munin/plugins
cd /opt/share/munin/plugins
# Récupérer le script
sudo wget http://blog.sinnwidrig.org/files/fail2ban_-0.1
# Rendre exécutable le script
sudo chmod +x fail2ban_-0.1
Munin est un outil de monitoring fonctionnant par script et collectant des informations sur le systeme à interval régulier (5min par défaut), Munin affiche des graphiques concernants des informations qu’il collecte dans /proc. Les graphiques sont accessibles via apache, il faut donc également sécuriser l’accès à celui-ci. Il faut installer trois choses différentes :
le programme munin,
le daemon munin-node qui va monitorer les informations système,
et apache2 qui nous permettra de visualiser les graphiques.
Here are some basic munin plugins for snort using perfmon (Enable preprocessor perfmonitor in snort.conf) The snort.conf entry should look something like:
preprocessor perfmonitor: time 300 file /your/path/to/snort.stats pktcnt 5000
(Read the snort docs for more info on performance issues etc.)
 Munin est un outil de surveillance basé sur le célèbre RRDTool, permettant de connaître toutes les données systèmes des autres ordinateurs du réseau. Il les présente automatiquement sous forme de graphiques consultables depuis une page web. Par ailleurs, il dispose d’un système de plugins qui le rend simple d’utilisation et très modulaire.
