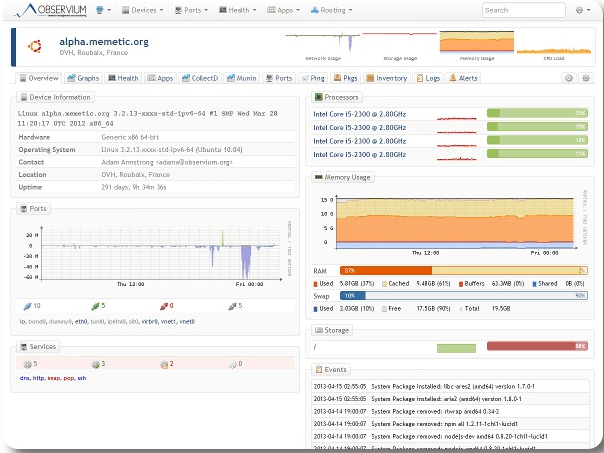
You have a problem while monitoring your servers, switches or physical machines. Observium fits your need. As a free monitoring system, it helps you to monitor your servers remotely. It is an auto-discovering SNMP based network monitoring platform written in PHP which includes support for a wide range of network hardware and operating systems including Cisco, Windows, Linux, HP, NetApp and many other. I will give you the steps to follow while setting up an Observium server on Ubuntu 12.04.
Currently there are two different versions of observium.
The observium Community is a free tool and licensed under the QPL Open Source license. This version is the best solution for small deployments. It gets security updates each 6 months.
While the second version, the Observium Professional is distributed under SVN based release mechanism. And it gets daily security updates. This tool is the best for Service Provider and enterprises deployments.
You have configured your MySql replication, next step is to perform maintenance and monitor your replication. Percona Toolkit for MySQL is a collection of advanced command-line tools to perform a variety of MySQL server and system tasks.
The Percona Toolkit allows you to amongst many tasks to verify MySQL replication integrity, efficiently archive rows, find duplicate indexes, summarize MySQL servers, analyze queries from logs and tcpdump, collect vital system information when problems occur.
To get started you need to install Percona Toolkit, I’m using Ubuntu as an OS on my servers, installing the percona toolkit was straight forward
apt-get install percona-toolkit
To get a summary of your databases use the command – pt-mysql-summary
pt-mysql-summary --u=username --p=password
Next you would want to setup a heartbeat table in your database so you can Monitor MySQL replication delay – for that you will use the pt-heartbeat command.
pt-heartbeat measures replication lag on a MySQL or PostgreSQL server. You can use it to update a master or monitor a replica. mk-heartbeat depends only on the heartbeat record being replicated to the slave, so it works regardless of the replication mechanism. It works at any depth in the replication hierarchy; for example, it will reliably report how far a slave lags its master’s master’s master.
Start daemonized process to update test.heartbeat table on master:
Installation, configuration et administration d’un serveur dédié
Ces tutoriaux ont été réalisés sous Debian (versions Etch 4.0 et Lenny 5.0) mais peuvent être transposés à d’autres distributions Linux, notamment Ubuntu. Ils sont applicables aux serveurs dédiés 1&1, Dedibox, OVH, Amen, et bien d’autres.
Tous les tutoriaux sont basés sur un serveur nommé test.alsacreations.com pour lequel nous disposons d’un utilisateur dew et d’un accès root (super-administrateur), chacun avec leur propre mot de passe.
Nous partons de l’idée d’obtenir un serveur web avec tout ce qu’il faut pour héberger plusieurs domaines et sites. Vous pouvez tout configurer à la main ou bien faire confiance à un panel d’administration.
Liste complète sans panel web
Ces tutoriaux conviennent à l’installation complète d’un serveur
Attention : nous préconisons désormais l’utilisation du panel ISPConfig, en lieu et place du panel DTC. Il est tout aussi simple à installer et à utiliser. Veuillez vous référer à sa documentation.
Need to monitor Linux server performance? Try these built-in command and a few add-on tools. Most Linux distributions are equipped with tons of monitoring. These tools provide metrics which can be used to get information about system activities. You can use these tools to find the possible causes of a performance problem. The commands discussed below are some of the most basic commands when it comes to system analysis and debugging server issues such as:
Finding out bottlenecks.
Disk (storage) bottlenecks.
CPU and memory bottlenecks.
Network bottlenecks.
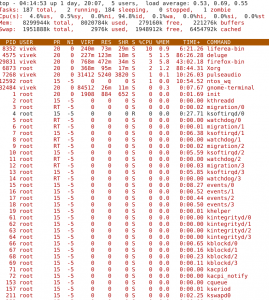
#1: top – Process Activity Command
The top program provides a dynamic real-time view of a running system i.e. actual process activity. By default, it displays the most CPU-intensive tasks running on the server and updates the list every five seconds.
Commonly Used Hot Keys
The top command provides several useful hot keys:
Hot Key
Usage
t
Displays summary information off and on.
m
Displays memory information off and on.
A
Sorts the display by top consumers of various system resources. Useful for quick identification of performance-hungry tasks on a system.
f
Enters an interactive configuration screen for top. Helpful for setting up top for a specific task.
o
Enables you to interactively select the ordering within top.