Fail2ban is a very useful and powerful solution to limit the bruteforce on your server. but fail2ban doesn’t provide you a way to contact directly the IP provider’s of bruteforce attacks source. I have modify an fail2ban action file’s and create a script for that.
monit is a utility for managing and monitoring, processes, files, directories and devices on a UNIX system. Monit conducts automatic maintenance and repair and can execute meaningful causal actions in error situations.
Monit Features
Daemon mode – poll programs at a specified interval
Monitoring modes – active, passive or manual
Start, stop and restart of programs
Group and manage groups of programs
Process dependency definition
Logging to syslog or own logfile
Configuration – comprehensive controlfile
Runtime and TCP/IP port checking (tcp and udp)
SSL support for port checking
Unix domain socket checking
Process status and process timeout
Process cpu usage
Process memory usage
Process zombie check
Check the systems load average
Check a file or directory timestamp
Alert, stop or restart a process based on its characteristics
MD5 checksum for programs started and stopped by monit
Alert notification for program timeout, restart, checksum, stop resource and timestamp error
Un jour vous pouvez resté bloqué par un mot de passe perdu pour accéder à Webmin et vous auriez besoin d’un moyen de le changer.
Voici comment: pour commencer, connectez-vous à votre système en ssh.Vous devez trouver où Webmin est installé et donc le chemin que le script utilisera pour réinitialiser le mot de passe. Lire la suite…
Update of December 6th : although Logstash does the job as a log shipper, you might consider replacing it with Lumberjack / Logstash Forwarder, which needs way less resources, and keep Logstash on your indexer to collect, transform and index your logs data (into ElasticSearch) : check out my latest blog post on the topic.
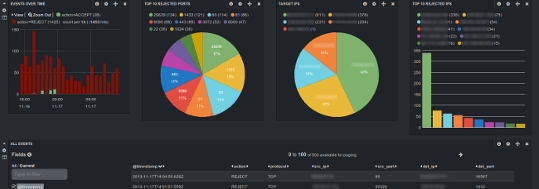
Kibana Dashboard
Even if you manage a single Linux server, you probably already know how hard it is to keep an eye on what’s going on with your server, and especially tracking logs data. And this becomes even worse when you have several (physical or virtual) servers to administrate.
Although Munin is very helpful monitoring various informations from my servers / VMs, I felt the need of something more, and bit less static / more interactive.
There are 3 kind of logs I especially wanted to track :
Apache 2 access logs
iptables logs
Syslogs
After searching arround on the internet for a great tool that would help me, I read about the open source log management tool Logstash which seems to perfectly suit a (major) part of my needs : logs collecting / processing.
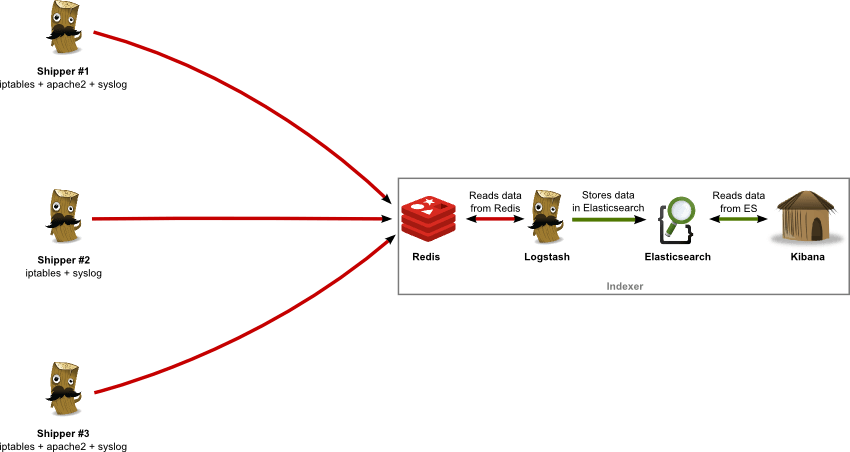
For the purpose of this post, I will take the following network architecture and assume and I want to collect my Apache, iptables, system logs from servers 1/2/3 (“shippers”) on server 4 (“indexer”) and visualize them :
As you can see, I am using 4 complementary applications, the role of each one being :
Logstash : logs collector, processor and shipper (to Redis) on log “shippers” 1-3 ; logs indexer on server 4 (reads from Redis, writes to Elasticsearch)
Redis : logs data broker, receiving data from log “shippers” 1-3
Whether you are in the web hosting business, or run a few web sites on a VPS yourself, chances are you want to display visitor statistics such as top visitors, requested files (dynamic or static), used bandwidth, client browsers, and referring sites, and so forth.
GoAccess is a command-line log analyzer and interactive viewer for Apache or Nginx web server. With this tool, you will not only be able to browse the data mentioned earlier, but also parse the web server logs to dig for further data as well – and all of this within a terminal window in real time. Since as of today most web servers use either a Debian derivative or a Red Hat based distribution as the underlying operating system, I will show you how to install and use GoAccess in Debian and CentOS.
Installing GoAccess on Linux
In Debian, Ubuntu and derivatives, run the following command to install GoAccess:
# aptitude install goaccess
In CentOS, you’ll need to enable the EPEL repository and then:
# yum install goaccess
In Fedora, simply use yum command:
# yum install goaccess
If you want to install GoAccess from the source to enable further options (such as GeoIP location), install required dependencies for your operating system, and then follow these steps:
# wget http://tar.goaccess.io/goaccess-0.8.5.tar.gz
# tar -xzvf goaccess-0.8.5.tar.gz
# cd goaccess-0.8.5/
# ./configure --enable-geoip
# make
# make install
That will install version 0.8.5, but you can always verify what is the latest version in the Downloads page of the project’s web site.
Since GoAccess does not require any further configurations, once it’s installed you are ready to go.
Running GoAccess
To start using GoAccess, just run it against your Apache access log.
For Debian and derivatives:
# goaccess -f /var/log/apache2/access.log
For Red Hat based distros:
# goaccess -f /var/log/httpd/access_log
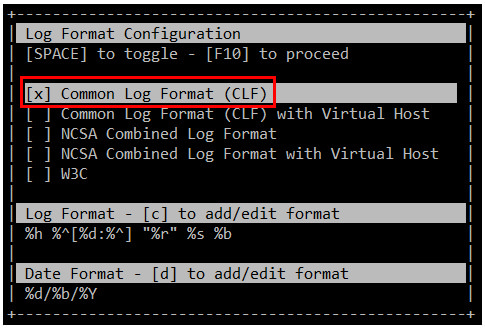
When you first launch GoAccess, you will be presented with the following screen to choose the date and log format. As explained, you can toggle between options using the spacebar and proceed with F10. As for the date and log formats, you may want to refer to the Apache documentation if you need to refresh your memory.
In this case, Choose Common Log Format (CLF):
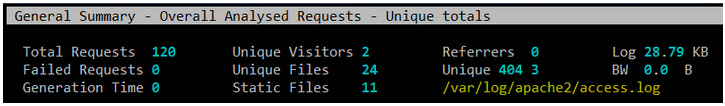
and then press F10. You will be presented with the statistics screen. For the sake of brevity, only the header, which shows the summary of the log file, is shown in the next image:
